Human activities have led to major changes in land use, often having profound effects on the environment, degrading entire landscapes, and transforming biodiversity, ecosystem functions, and climate.
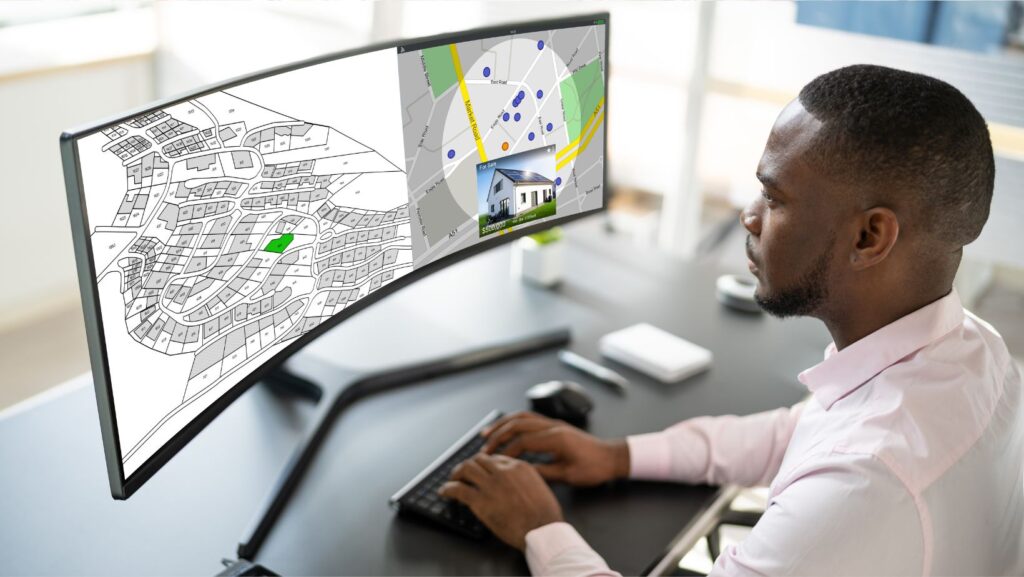
Today, professionals are increasingly turning to geographic information software tools to collect, manage, and interpret environmental data. These tools help illustrate, monitor, and mitigate environmental risks in industrial zones and the impact of industrial activity across both temporal and spatial dimensions.
Among the uses of mapping tools are interactive maps, map-based presentations, and presentations of thematic data, revealing potential risks and solutions.
The Environmental Situation In Numbers
The best mapping software integrates various data layers, including topography, land use, water bodies, and industrial infrastructure. These layers provide a comprehensive view of the industrial zone’s environmental situation.
Data from Greenpeace indicates which industrial sectors would benefit from leveraging mapping software the most. According to the organization’s latest report, the chemical manufacturing sector makes up more than 40% of all industries’ reported toxic score. Different equipment and metal manufacturers are also among the top polluters.
In 2021, the industry accounted for 59% of all greenhouse gas emissions and 32% of ozone precursor emissions in European Union member states.
Fossil fuels are still the most polluting sector worldwide. Emissions briefly declined during COVID-19 but started increasing after it ended. In 2022, they grew by 1%, reaching 40.5 gigatons of CO2.

According to a 2023 report by Climate Trade, roughly 11% of greenhouse gas emissions come from the agricultural sector. The third-biggest polluter is the fashion industry, generating about 10% of the annual carbon footprint. This is more than all maritime shipping and international flights together.
Sensors Provide Real-Time Monitoring Data
Sensors and remote sensing technologies like drones and satellites provide real-time data on air quality, water quality, soil conditions, and other environmental factors. This data can be integrated into mapping software for continuous monitoring.
Mapping Software Can Identify High-Risk Areas
Mapping software can model how airborne, waterborne, or soil pollutants disperse in and around the industrial zone. By simulating different scenarios, it helps in understanding potential contamination paths and identifying areas at high risk.
By analyzing historical data and predictive models, mapping software can assess the vulnerability of industrial zones to floods, earthquakes, or hurricanes, allowing for proactive risk management. Alerts can be sent out correspondingly – and swiftly. Research was conducted to test the latency of the Integrated Public Alerts and Warning System and its potential efficacy for the use of earthquake early warning systems on the US West Coast. Based on 688 survey responses, the median data latency was 8 seconds.
Users of mapping software can visualize environmental impact assessments to highlight areas where industrial activities might exceed regulatory thresholds, helping identify potential environmental risks early on.
Real-Time Monitoring Via Live Feeds
Integrating live data from sensors into the mapping software allows for real-time monitoring of environmental parameters. This enables immediate responses if chemical spills or air pollution spikes occur. Air pollution, in particular, is a huge problem. According to the American Lung Association’s 2024 report, 131 million people in the country are exposed to unhealthy air pollution levels.

Users can program mapping software to trigger alerts when certain environmental thresholds are breached, enabling prompt action to mitigate risks before they escalate.
Regulatory Compliance
Mapping software can set regulatory boundaries around industrial zones, ensuring activities stay within permissible limits. As of 2024, geofencing is compatible with 92% of smartphones. Users can set up alerts to notify operators if there’s a breach in compliance zones.
Mapping tools can generate automated reports based on environmental data, simplifying compliance with regulatory requirements. These reports can be customized for government agencies, environmental organizations, and members of the public.
Recap
- Maps software integrates topography, land use, and industrial infrastructure data
- It can integrate data from sensors for continuous monitoring
- It can model how pollutants disperse in the industrial zone
- Users can assess how vulnerable the zones are to natural disasters
- The software can trigger alerts upon breaching environmental thresholds


